
Mergesort Investigation 9 - memory access effects
As a way to see if merely accessing the linked list node’s memory causes the mergesort performance drops, I wrote two non-sorting functions and benchmarked them to try to distinguish
- accessing the nodes’ data
- modifying
.Nextpointers
I started with the code from my transliteration of the Wikipedia bottom up algorithm. Benchmarking shows it has the same abrupt performance drops as my original July 2021 algorithm, but the “merge” part is broken out in a separate function making it easier to perform different actions on the sublists to-be-merged. It’s also a little faster, so benchmarking will go quicker.
I wrote two variant programs.
Both have the same framework as Wikipedia’s bottom up mergesort with lists.
Both should access linked list nodes in roughly the same order.
I also added a function to my benchmarking program
that creates linked lists with .Data fields with increasing numerical values -
the linked list is already sorted.
- Walking sublists in the same length and order as the Wikipedia bottom up algorithm,
but incrementing
.Datafields of each node rather than switching.Nextpointers around. - Weaving a single list from two sublists by alternating
nodes from each of the sublists.
This switches around
.Nextpointers some, but mostly not as much as actually sorting. - Sorting an already sorted list. No
.Nextpointers get changed. - While I’m at it, sorting a reverse-sorted list.
Almost every
.Nextpointer change during merging is very local.
Walk sublists, increment .Data values
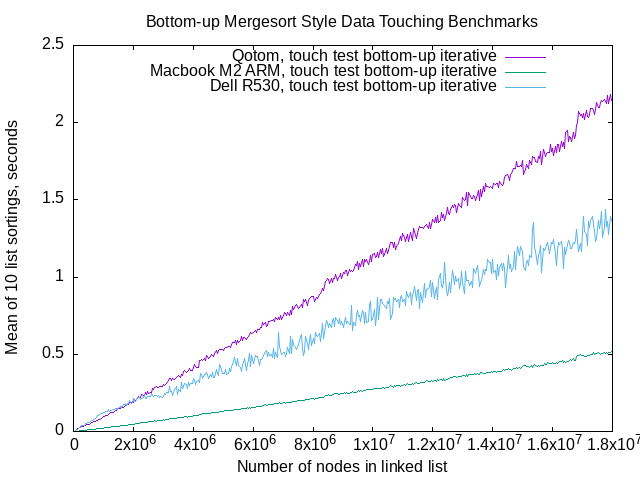
Above, walking sublists in the same length and order as the Wikipedia bottom up algorithm,
but incrementing .Data fields of each node rather than switching .Next pointers around.
I made a mistake setting the incrementing.
The data incrementing benchmarks used a 40,000 node increment on list lengths,
while my earlier benchmarking used a 400,000 node increment.
I used lines to visualize the performance instead of points.
I see no apparent performance drops.
The Dell R530 produces benchmarks with a lot more variation,
as in most of the other benchmarking.
Incrementing .Data values isn’t nearly as fast as walking linked lists,
but it’s much faster than sorting.
Walk sublists, weave .Next pointers
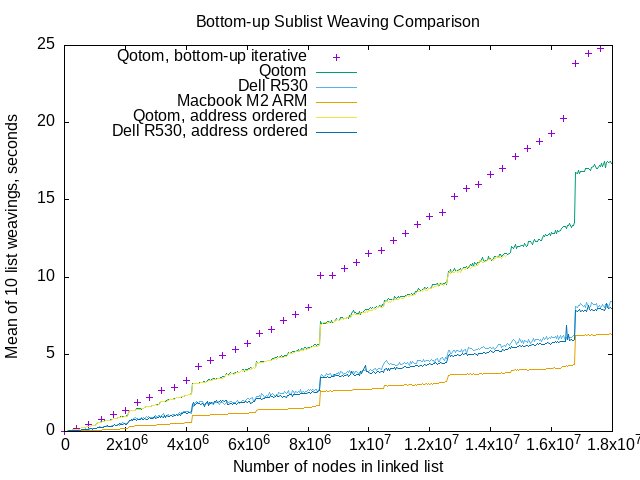
Above, weaving sublists in the same length and order as the Wikipedia bottom up algorithm. The purple plus signs in the graph above are the same data as the filled-in golden squares on this graph.
The weaving code looks like this:
    for *x != nil && *y != nil {
        t.Next = *y
        t = t.Next
        *y = (*y).Next

        t.Next = *x
        t = t.Next
        *x = (*x).Next
    }
In the above, x and y are of type **Node,
assigned to left and right sublists at random.
I made a mistake setting the incrementing. The sublist weaving benchmarks used a 40,000 node increment on list lengths, while my earlier benchmarking used a 400,000 node increment.
I used lines instead of points to create the graph above.
At 10 sublist weaving points for every single iterative algorithm benchmark point,
gnuplot created a fuzzy-looking graph
for the sublist weaving benchmarks.
The “points” symbols that gnuplot uses are too large to create
good visualizations for the smaller increment.
Surprisingly, it looks like other abrupt performance drops show up, at roughly 221 list length increments.
Anomaly detection
I’d like some objective measure of whether or not the every-2MiB-steps in the “weaving sublists” benchmarks actually exist. I tried some simple anomaly detection.
I chose to use the Qotom fanless server’s sublist weaving benchmarks, represented by the green line labeled “Qotom” in the graph above. The apparent steps or drops in performance are larger than for the other machines’ benchmark data.
I calculated the time increment from one benchmark datum to another, small “bumps” in mean elapsed time for 10 sorts. I calculated each bump’s z-value, and plotted the z-values.
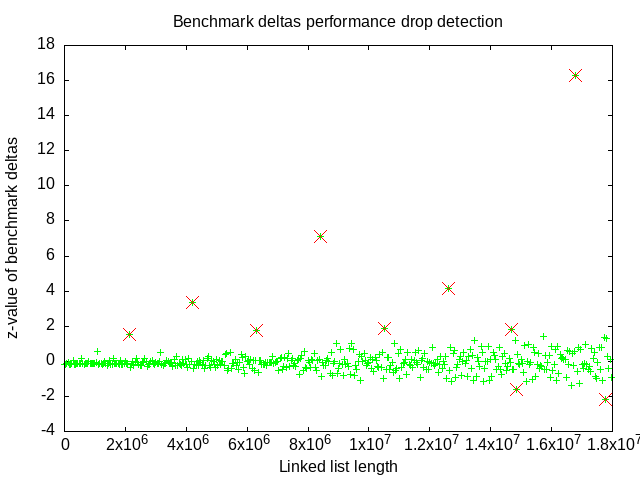
The above graph’s dots are the z-values of bumps in mean sublist weaving benchmark time from one list length to the next of the Qotom fanless server, which is the purple points in the first graph on this page, above. I chose the Qotom server’s benchmark data because there’s less visible elapsed time variation from one list length to the next. I believed that any anomalies would be easier to detect.
The red dots are z-values greater than 1.5 or less than -1.5. The choice of 1.5 and -1.5 is admittedly convenient. I wish that the negative bumps had been smaller. There’s some relationship to list lengths that are powers of 2.
| List length | z-value | log2(list length) | Δ list length |
|---|---|---|---|
| 2121000 | 1.540751 | 21.02 | |
| 4201000 | 3.362053 | 22.00 | 2080000 |
| 6321000 | 1.750901 | 22.59 | 2120000 |
| 8401000 | 7.106960 | 23.00 | 2080000 |
| 10521000 | 1.897553 | 23.33 | 2120000 |
| 12601000 | 4.135628 | 23.59 | 2080000 |
| 14681000 | 1.826495 | 23.81 | 2080000 |
| 14841000 | -1.607975 | 23.82 | (ignored) |
| 16801000 | 16.262354 | 24.00 | 2120000 |
| 17761000 | -2.158296 | 24.08 | (ignored) |
I believe this helps show that anomalies, the abrupt performance drops, appear at list lengths about 221 or 2097152 apart.
Recursive mergesort, small increment
Do these extra performance drops show up if I run my recursive mergesort algorithm at a smaller list length increment between timings? I benchmarked recursive mergesort with small increments in linked list length to see if it shows performance drops.
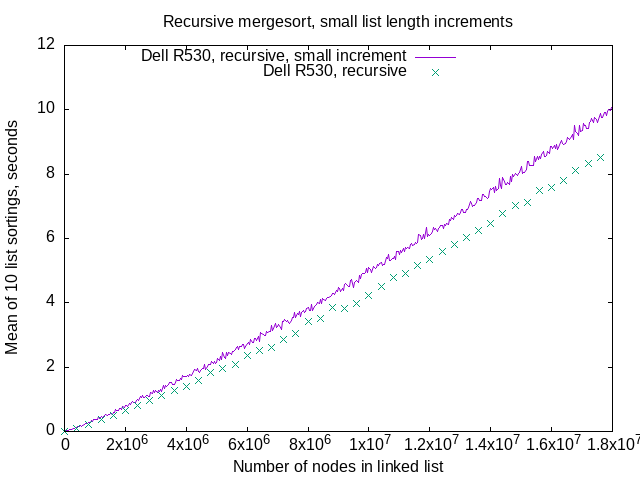
The turquoise colored points, labeled “Dell R530, recursive” above,
are the same as the “Dell R530 #1”
gold-colored squares on this graph
For the smaller increment benchmarking,
there’s 10 list lengths benchmarked between turquoise points,
so I had gnuplot draw a purple line instead of drawing individual points
which looks fuzzy and uninformative.
The difference in performance arises from me making a code change that improves clarity (I think) at the expense of a little performance.
Old:
for left != nil && right != nil {
    var n *Node
    if left.Data < right.Data {
        n = left
        left = left.Next
    } else {
        n = right
        right = right.Next
    }
    t.Next = n
    t = t.Next
}
New:
for left != nil && right != nil {
    n := &right
    if left.Data < right.Data {
        n = &left
    }
    t.Next = *n
    *n = (*n).Next
    t = t.Next
}
For the “new” code, I made the merge happen through chasing pointers-to-pointers, an extra de-reference on each node advance. Fewer lines of code mean fewer bugs, generally, and decreases human readers’ cognitive burden to understand the code.
In any case, the recursive linked list mergesort does not show the abrupt performance drops even when I graph smaller linked list length increments.
Iterative mergesorts, small increment
Do these extra performance drops show up if I run my iterative mergesort algorithm (July 2021 algorithm) and Wikipedia bottom-up with lists algorithm at a smaller list length increment between timings?
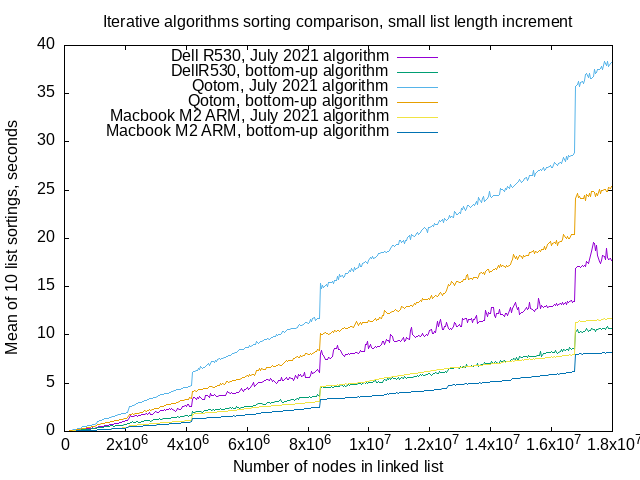
Above, running 10 sorts of randomly-valued linked lists at 40,000 node increments, list lengths from 1,000 nodes, to 17,961,000 nodes. If you squint, you can see a few steps at multiples of 221 on bottom-up algorithm lines in the above graph, about 6x10⁵ and 1.3x10⁷, but really at no other places.
Once again, the Dell R530 produces benchmarks with more variation (purple line), at least with my July 2021 algorithm.
Sorting an already sorted list
Sorting an already sorted list should demonstrate that
changing .Next pointers is most of what causes the abrupt performance drops.
All the node value comparisons take place,
all the work of merging sublists occurs,
but no (or at least very few) .Next pointers change.
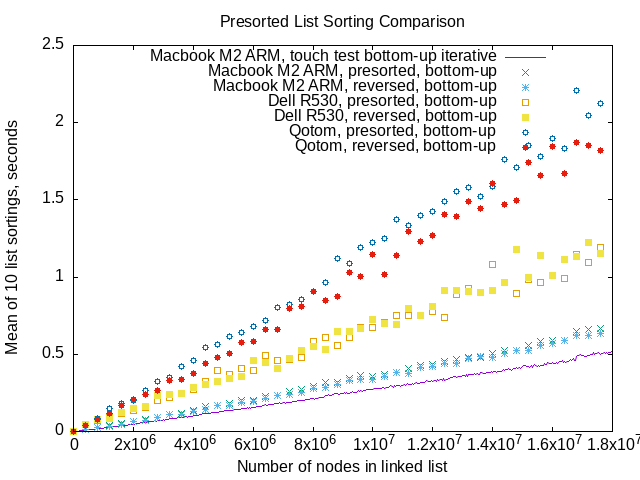
That’s benchmarking for mergesorting linked lists whose data values
are either already sorted (low to high),
or sorted high-to-low,
the reverse of what the algorithms do.
The purple line in this graph is the same data
as the green line in the data touching benchmark
above.
I used 400,000 node increments in list length for this graph,
so gnuplot points work for visualization.
In the above benchmarking, the Qotom fanless server has the most variation in benchmarks. I don’t see anything approaching the abrupt performance drops you can see when sorting randomly-valued lists on any of the machines.
Conclusions
At the very least, this experiment shows that merely accessing the nodes’ data
isn’t what causes the performance drops,
it’s changing the .Next pointers and following those changed pointers.
I still don’t understand why changing .Next pointers around,
and then following them in the next merge of two sublists
causes the performance drops at
specific linked list lengths.
The sorting pre-sorted lists and reverse-sorted lists benchmarking demonstrates
that changing .Next pointers is involved in causing the performance drops.
But changing just any old .Next pointer isn’t enough,
sorting reverse-sorted linked lists doesn’t show any abrupt performance drop,
yet a sort involves changing every single .Next pointer in the list.
There may be some very small performance drops at linked list lengths that are multiples of 221, but nothing like the bigger steps that caused me to investigate in the first place.